Each student is unique and needs a unique pattern of study and how we at nthexam provide right personalisation
The internet is bombarded with data in each field and education is untouched. There is million of data uploaded to internet each and every day in fact each and every minute. This is going to be tremendous in coming future with more and more digitisation
The use of machine learning and artificial intelligence seems indispensable to provide the right data for learning pattern to the learners. Educator needs to create the best quality to stay ahead in the race as well.
Well if the problem arise, there is always a solution to it and we at nthexam.com provide the best personalisation that tackle each student’s need and what educators can provide to achieve 1:1 student : teacher ratio scenario which otherwise is near impossible manually.
Case1: To identify the weak areas of student?
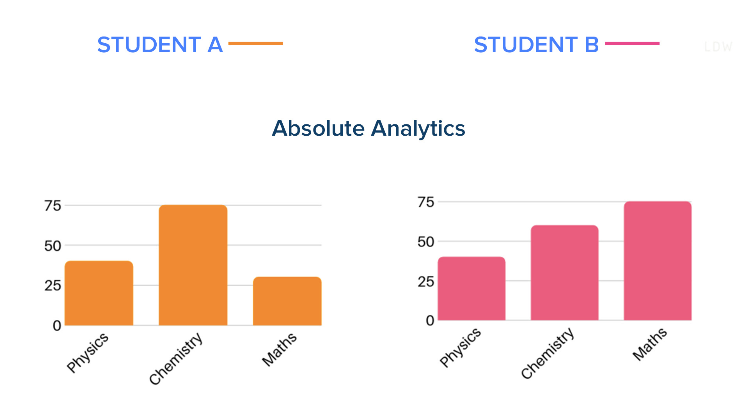
ach student need to know his or her weak areas of improvement, we have seen there are numerous online/offline application which claim to provide the analytics and so called personalisation to student. Is analytical data in form of charts representation enough for student to know what he/she wants or what he/she should focus. So Student A and Student B are provided with marks in each section in a test or assignment and same ‘analytics’ are provided to teacher. Teacher still does not know where he needs to focus and each student are in wrong assumption what are their weak areas. Student A feels he/she needs more to focus on Maths and Student B feels more to focus on Physics. “ITS A HUGE MISTAKE FOR BOTH STUDENT AND TEACHER”
Case2: To miss the potential converters completely.
Many a times some students who are performing good enough miss by a mere margin of few marks and that too in some sections. Oh!! It reminds me of my preparation for IIT entrance in 2005, when my overall score was so high but missed in physics by just 2 marks. These types of student are in ‘critical boundary condition’ and need just a small push to surpass a big number of student and secure competitive rank.
Case 3: Different pattern of the study and study time.
Performance in actual is just not a matter of knowledge, however it may depends upon the other factors like smart study, preparation in actual time scenario, near real experience, performance in stress, comeback potential after few bad attempts, mood and behaviour of student, optimum interest in different sections, categories and subject. They need the right ‘recommendation’ that cannot be done unless someone is tracking each and every student personally
Case 4: Memory for each student can’t be same
The ‘memory retention’ of each student is not same is a universal fact, still students are provided with the same study material and provide a common pattern of revision to every student in a ‘class’ or ‘batch’. The forgetting curve of each student has a different half life and recall probability as well.
There are many other factors and cases which can be discussed for hours. We need to have a separate discussion on each cases and we provide the best solution to each.
Still the question is unanswered, So how nthexam provide personalisation? To provide a layman explanation below is a simplistic diagram to tell what at nthexam is provide as product beyond analytics unlike others who just claim the use of personalisation, ML and AI
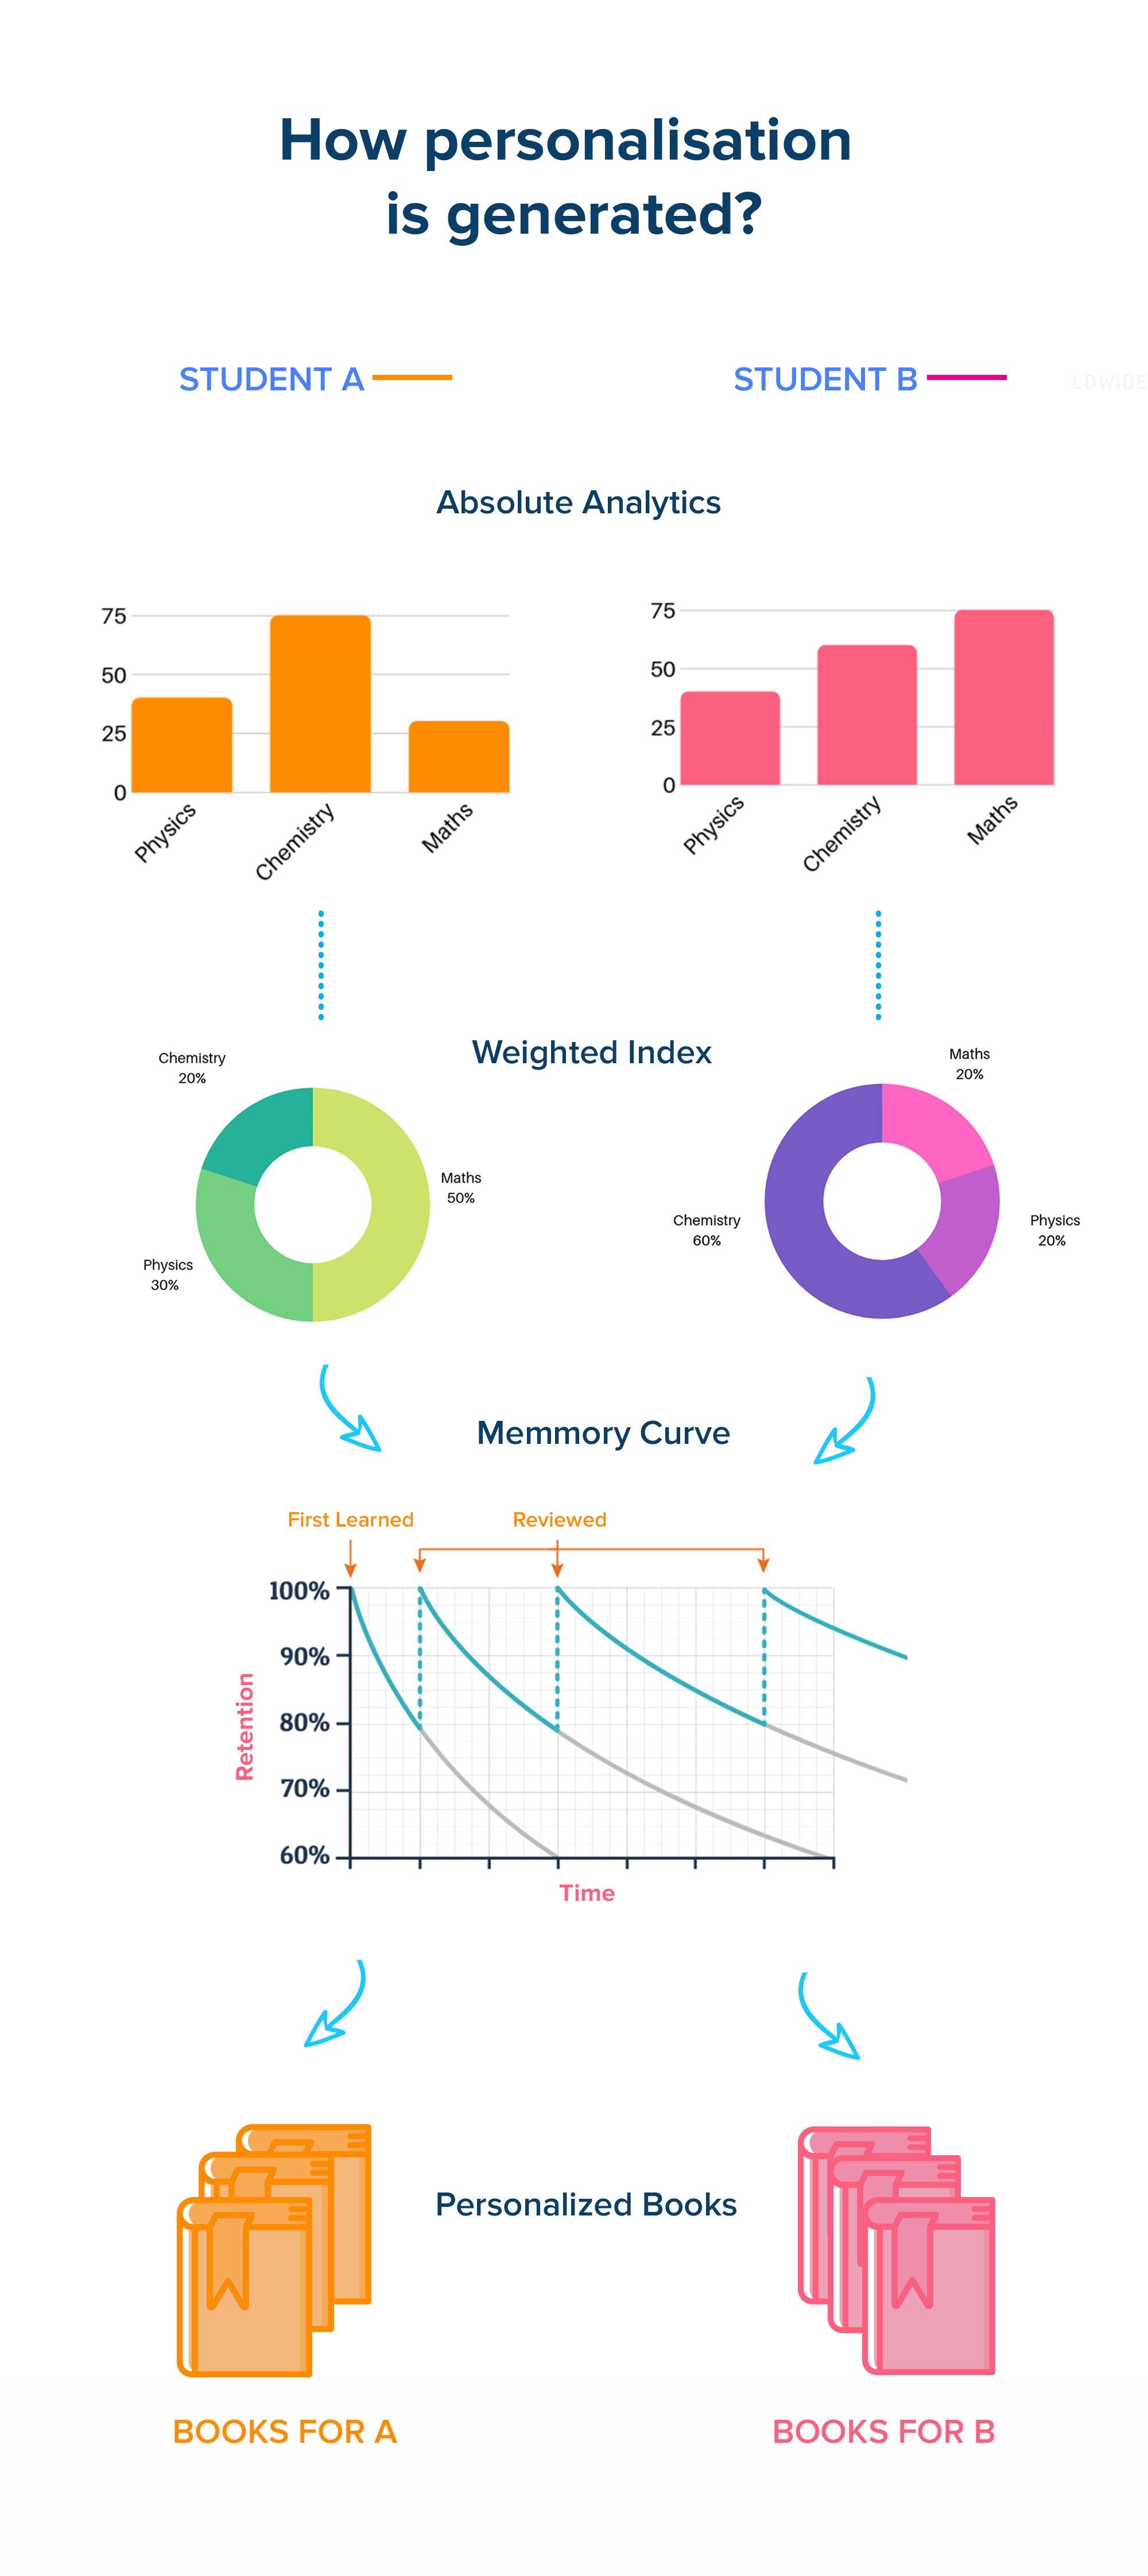
If still interested to know more, here is how we do the engineering and research to achieve the personalisation.
TL, DR
Marks secured in different categories, sub categories(subject), sub subcategories(topics)
Difficulty levels, easy, medium and hard
Time taken
Memory retention of each and every student
Creating cohorts for student grouping
Behaviour pattern of attempts
Accuracy index
Weighted pattern for each type of mock test, rankers test, personal and general assignment, self created practice sets, nthexam recommendations, pro-metric tests.
Time of attempts
Relative performance
Absolute performance
Scaling of the score and percentile for different recommendations.
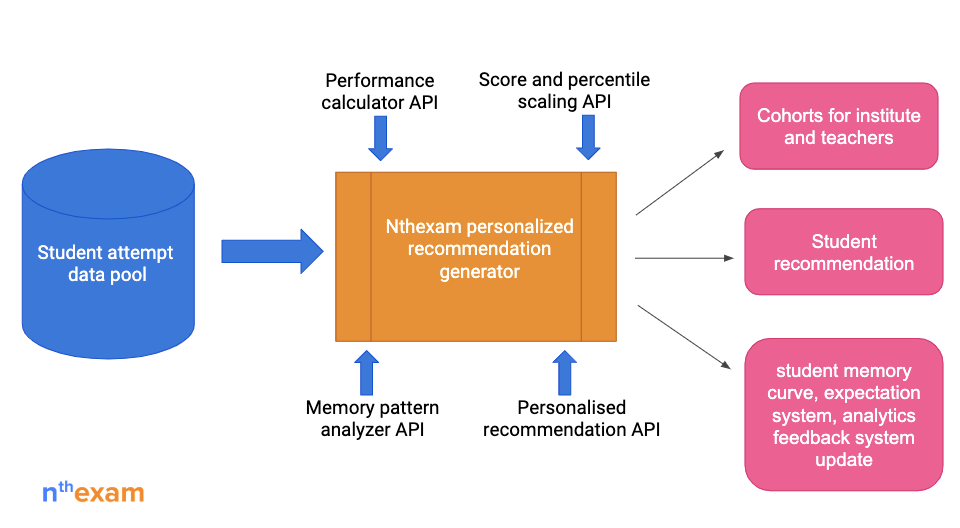
We have a pool of performance data at our backend ie, database.
The performance calculator API, personalised recommendation API, score and percentile scaling API, Memory pattern analyser API, are used to generate the recommendation. Each recommendation is generated with an expectation score and which on each attempt is updated.
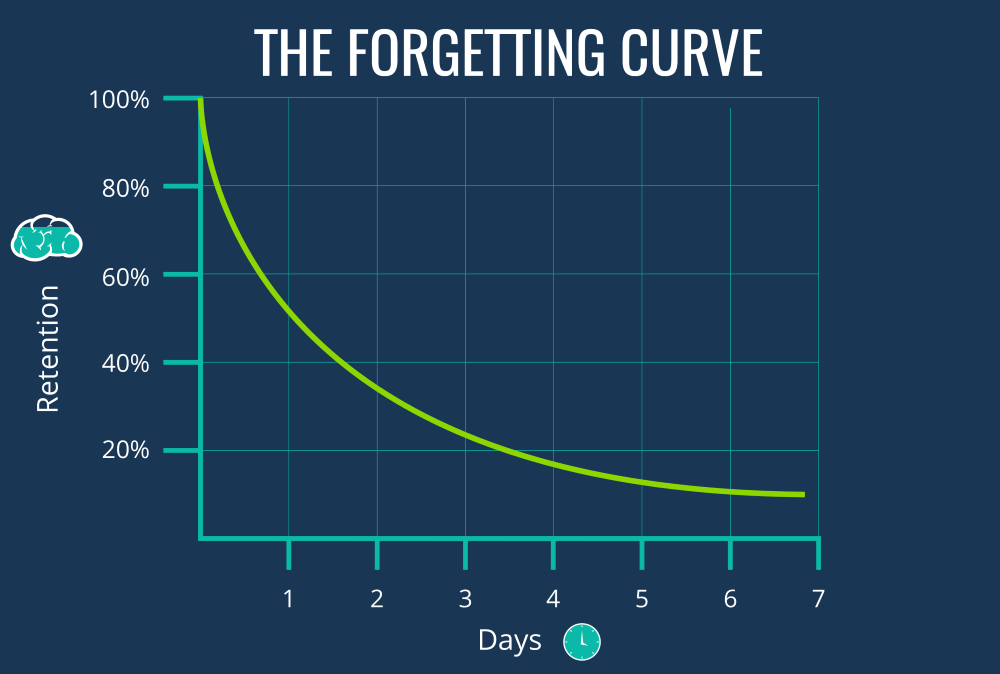
One of the most important part of revision is not just throwing a topic or question to student however what and when to provide to the student. Each student have a different forgetting curve for different topics and subjects, even at different level. Sometimes we need to create a related situation to make him memorise the topic.
The forgetting curve:
We follow a half life pattern for each category, subject and topic for each type of difficulty levels of questions.
We use the factor coefficients to generate a normal distribution curve and predict the next time for revision for different topics. On each attempt of the question we update the fact, on successful attempted before the revision date the student is rewarded otherwise penalised more. On the other hand if student make a success attempt of the topic after the revision date he is rewarded more than doing a failure attempt which is penalised less.
If student does not attempt himself we throw a recommendation to student on when to study the previously learned topic.
This create the recall probability and fact of each student performance and attempt that we save in nthexam system.
Scaling of the performance: We take various attempt at different levels and from different pattern and it needs to be scaled on a system
Percentage = scaleFunction(a, b, c) ;
Percentage are mapped with the normal distribution curve.
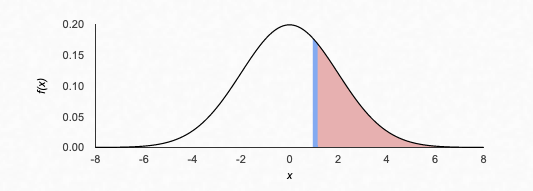
The data set of student is generated based on the different levels of category, time, accuracy, difficulty level and other factors. Constants are defined to find which are input to the functionStudentDistribution().
studentDistributionDataSet = functionStudentDistribution( constantObject, dataSet)studentDistributionDataSet = functionStudentDistribution( constantObject, dataSet)Distribution of student and critical boundary condition: The graph tells the different zones of student distribution for example cutoff students, potential converters and toppers and based on the standard deviation it provide the critical factor, δc.
We distribute in n zones zi, and δc.
The same graph is scaled based on institute level, and global level
Red is for institute level and Green is for global level. The more green is towards right than red, the better the performance of the coaching institute. We provide some of the many recommendation based on zi, (zi±δc).
